QuPath region annotation
SpaceBlocks lets you overlay manual region annotations (tumour, healthy, necrosis, …) onto your samples. You draw them once in QuPath, export them as GeoJSON, and the pipeline folds them into obs["region_annotation"].
This is an optional but recommended step because it unlocks the region-aware analyses (neighbourhood, per-region co-occurrence, region-level pseudobulk). Without it, every cell will be Unlabeled.
Choosing QuPath means anatomopathologists and researchers without bioinformatics skills can annotate the histology directly, while the annotations stay easy to fold back into the AnnData objects.
Napari is a possible alternative for writing the GeoJSON files, but it is a Python application aimed at programmers.
1. Get the image to annotate
| Mode | How to obtain the image |
|---|---|
visiumhd / xenium5k (a Headblock runs) |
snakemake qupath_images writes one image per sample under Samples/{sample}/QuPath_image/ (a Hi-Res PNG for Visium HD, a morphology TIFF for Xenium 5K). |
decoupled (no Headblock) |
There is no qupath_images target — the image is instead embedded in the contract h5ad you provided (uns["spatial"]). Annotate the regions when you build the contract externally (see Preparing inputs for decoupled mode). |
2. Annotate in QuPath
- Open the image in the QuPath desktop application.
- Open the
Annotationstab. - Select a region on the tissue image (we recommend the polygon tool).
- Right-click the polygon → Set classification → choose the region label.
- Repeat until the slide is fully annotated.
- Select all annotations → File → Export objects as GeoJSON → Export as feature collection.
- Save the file following the naming convention below, into the folder referenced by
config["geojson_path"].
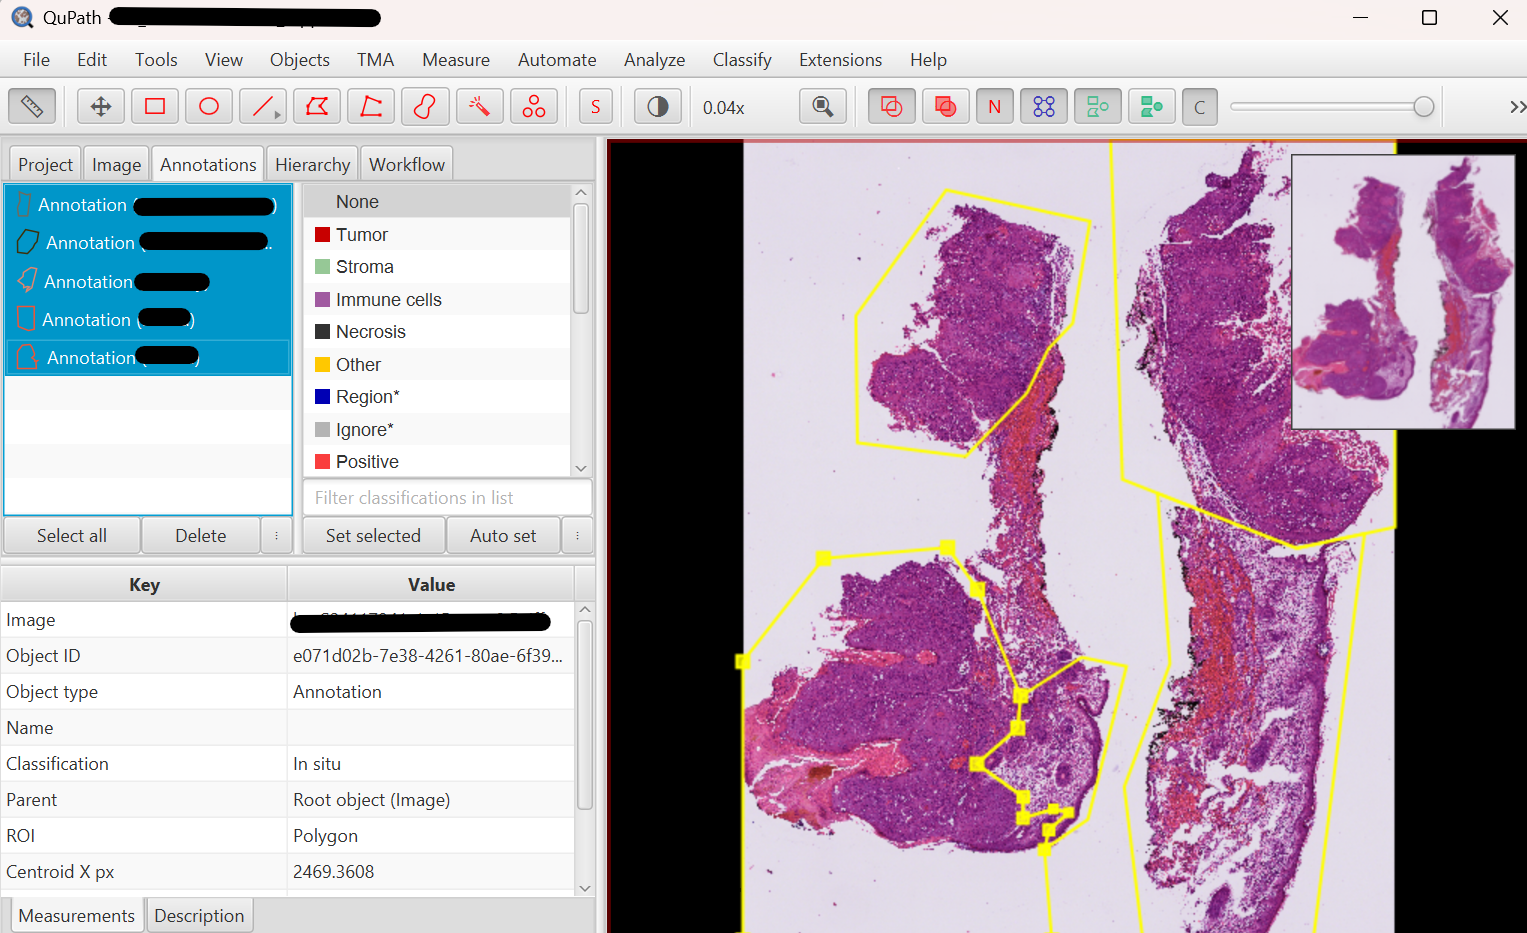 |
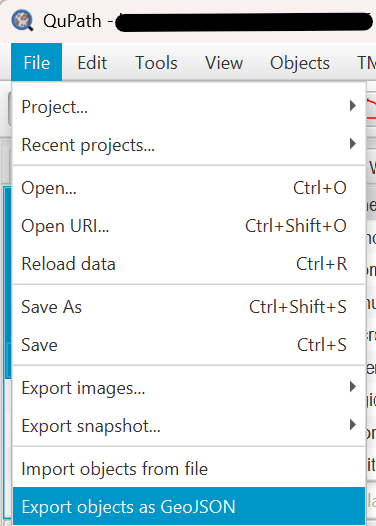 |
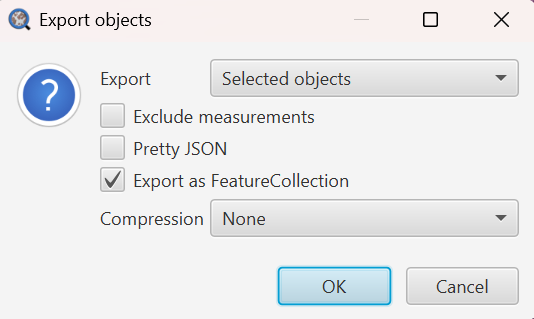 |
| Step 5 Select all annotated regions |
Step 6 File > Export objects as GeoJSON |
Step 7 Save with naming convention |
3. Naming convention
| Mode | GeoJSON filename |
|---|---|
| Visium HD | {sample}_tissue_hires_image.geojson |
| Xenium 5K | {sample}_morphology.geojson |
The region labels you set as classifications become the values of obs["region_annotation"]; list
them (and their colours) under analysis.region_levels / analysis.region_colors in
config.yaml so they render consistently downstream.